|
Gazprom
pipelines and export capacity
Газопроводы Газпрома и экспортные мощности
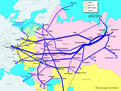
Gas pipelines of West Siberia

Газопроводы Западной Сибири
Export flows of Gazprom
Экспортные потоки
Spot, Gazprom, Brent
Цены на нефть и
газ
End-use price of gas
Russia and USA
Daily gas production
Суточная добыча
| |
Comments on Financial Report of
Gazprom for Q1-2005
-
Compared with Q1-2004, Gazprom has reduced the
export duty payment rate by 1.2%. In absolute terms, it means savings of $90
million in Q1-2005. Apparently, Gazprom reduced
export duty on transit payment gas.
-
The surprising and unbelievable drop of total
production expense in Q4-2004 means that the production cost per 1000 cub m
(mcm) has suddenly declined by over 15%. However, in Q1-2005 the production
cost per mcm was reported at about the level of Q3-2004.
-
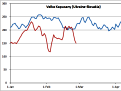
The 22% increase of total production expense from Q4-2004 to Q1-2005
is caused mainly by the rise of mineral production tax from RUR107/mcm to
RUR135/mcm (Figure 1). The new rate became effective on January 1, 2005.
Note that from January 1, 2006, the tax rate will be raised to RUR147/mcm.
|
|
Figure 1 |
Figure 2 |
|
|
 |
 |
|
|
Source:
Financial reports of Gazprom
Figure
3 |
Figure 4 |
|
|
 |
|
|
Source:
Financial reports of Gazprom |
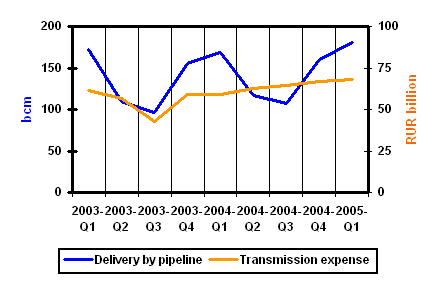
-
Apparently, Gazprom uses a simplified approach
to the calculation of transmission expenses (Figure 2). The reported
expenses do not reflect seasonal swing as they should and had before.
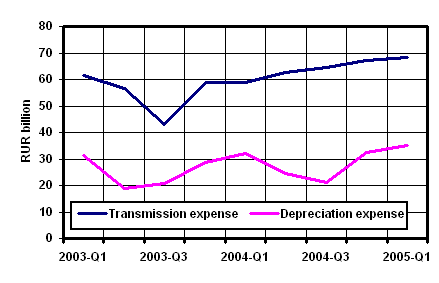
-
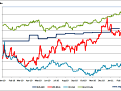
Total depreciation expense of Gazprom does
reflect seasonal swing (Figure 3).
-
Depreciation of transmission assets represents
over 60% of the total depreciation of Gazprom, so it should affect the total
transmission expense.
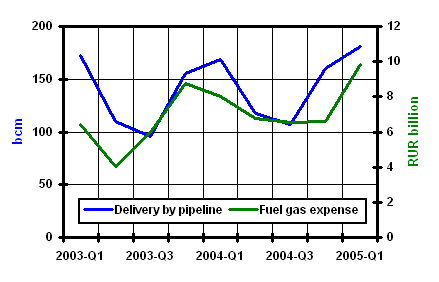
-
From Q4-2004 to Q1-2005, fuel gas expense
increased by 49% (Figure 4).
-
In the same time, combined production and
transmission expenses increased by 9%.
-
Fuel gas expense (or total cost of gas used at
compressor stations) is calculated at the delivery cost of gas, which
depends on production and transmission cost.
-
Apparently, Gazprom has increased its internal
transfer price of gas.
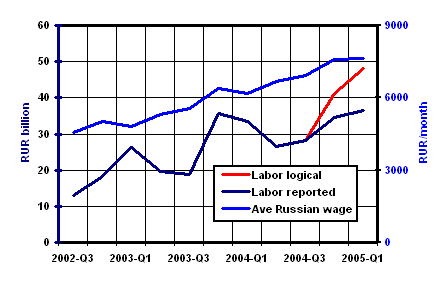
-
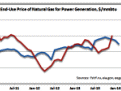
The reported staff cost is still lower than
expected (Figure 5).
|
|
Figure 5 |
Figure
6 |
|
 |
|
 |
|
Source:
Financial reports of Gazprom |
|
|
|
|
|