|
Gazprom
pipelines and export capacity
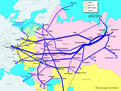
Газопроводы Газпрома и экспортные мощности
Gas pipelines of West Siberia

Газопроводы Западной Сибири
Export flows of Gazprom
Экспортные потоки
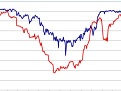
Spot, Gazprom, Brent
Цены на нефть и
газ
End-use price of gas
Russia and USA
Daily gas production
Суточная добыча
| |
Comments on Financial Statement of
Gazprom for January-September 2006
-
According to unaudited interim
financial statement as of September 30, 2006, Gazprom shows excellent
results in sales of liquids (crude oil, condensate and refined products) and
moderate ones in sales of natural gas.
-
Revenue from sales of liquids
in January-September 2006 is up 311% from the same period of 2005 - RUR 474.3
bn (USD 17.7 bn) and RUR 115.3 bn (USD 4.3 bn), respectively.
|
-
Net revenue from sales of
natural gas in the first nine months of 2006 is up 39% from the same period
of 2005 - RUR 1,008.3 bn (USD 37.7 bn) and RUR 723.3 bn (USD 27.0 bn).
-
The growth was mainly provided
by the sharp increase of European prices.
-
Increase of revenues from
sales to the former Soviet states and to the Russian Federation were the
second and third major factors, respectively.
-
Total reported revenue is up
75% - from RUR 902.2 bn (USD 33.7 bn) to RUR 1,581.3 bn (USD 59.0 bn).
-
Total operating expenses are
up 72% - from RUR 587.3 bn (USD 21.9 bn) to RUR 1,012.9 bn (USD 37.8 bn).
-
Total transmission expense is
up 19% - from RUR 213.3 bn (USD 8.0 bn) to RUR 253.1 bn (USD 9.4 bn).
-
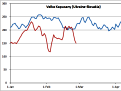
Note that the total
transmission expense in Q1-2006 went down while the volume of gas delivered
by pipelines increased - this is impossible (Figure 1).
-
The Q3-2006 transmission
expense per 1000 cub m (reported expense divided by the reported volume of
gas delivered by Gazprom pipelines) is 133% (more than twice) higher
than that of Q1-2006.
|
|
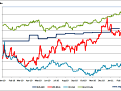
-
As usually, the reported
transmission expense is not sensitive to its most important component -
depreciation expense (Figure 2).
-
Depreciation expense
fluctuates in accordance with the seasonal changes in deliveries and sales
of gas.
-
Note that in Q2-2006, the
total transmission expense went up while the depreciation expense went down,
which is impossible.
-
Nine-month gas production
expense is up 19% - from RUR 129.3 bn (USD 4.8 bn) to RUR 154.3 bn (USD 5.8 bn).
-
According to numerous official
statements, Gazprom is motivated by profit only.
-
In the first nine month of
2006, RosUkrEnergo reported a loss of USD 532 million.
-
It is unclear why does Gazprom
want to keep the broker that loses money?
|
 |
Mikhail Korchemkin,
February 15, 2007
|
|