|
Gazprom
pipelines and export capacity
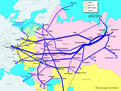
Газопроводы Газпрома и экспортные мощности
Gas pipelines of West Siberia

Газопроводы Западной Сибири
Export flows of Gazprom
Экспортные потоки
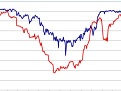
Spot, Gazprom, Brent
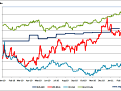
Цены на нефть и
газ
End-use price of gas
Russia and USA
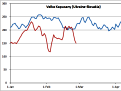
Daily gas production
Суточная добыча
| |
Important Changes in Russian Gas
Business Environment
Discrepancies of 2004 Financial
Report of Gazprom
|
|
Figure 1 |
Figure 2 |
|
 |
 |
|
Source:
Financial reports of Gazprom |
Figure 3 |
|
-
In Q4-2003
and previous years, all named expenses showed normal seasonal growth.
-
Gazprom costs are affected by
seasonal character of gas production and sales.
-
The costs are also strongly
affected by internal transfer prices (prices used for transactions within
the company) set by Gazprom management.
-
According to quarterly financial
reports, the change in expenses by segment is primarily due to changes in
internal transfer prices.
|
 |
-
The phenomenon of declining
total costs under growing volumes of production and sales is reported for
the first time in Gazprom history.
-
Note that from Q3 to Q4-2004,
all reported expense items (labor, materials, electricity, depreciation and
other) increased.
-
Apparently, the reported labor
expense is also wrong (Figure 4).
-
From 2003 to 2004, the reported
number of full-time employees increased from from 354 to 392 thousand.
-
According to Gazprom, the
average monthly wage of the company increased 27%.
-
However, the reported labor
expense of Q4-2004 is about the same as in Q4-2003.
-
Note that RF State Department of
Statistics reported the average wage of Russian gas industry in 2004 at RUR
33,747.2 ($1,216) a month.
-
Gazprom reported its 2004
average wage at RUR 25,700 ($926) a month.
-
Gazprom employs more than 99% of
workforce of Russian gas industry.
-
In 2005, RF State Department of
Statistics discontinued monthly reports of average wage in gas industry.
|
|
Figure 4 |
Figure 5 |
|
 |
 |
|
Source:
Financial reports of Gazprom |
|
-
The reported electricity expense looks incorrect as well (Figure 5).
-
The consumption of bought electricity in 2004 is about the same as in 2003.
-
The electricity tariffs of 2004 were higher than in 2003.
-
Reported electricity expense in Q4-2004 is lower than in Q4-2003, which is
very unlikely.
-
Apparently, reported expenses of
Gazprom are incorrect.
-
We will give more details in the
first issue of Russian Gas Quarterly to be released in August.
|
|