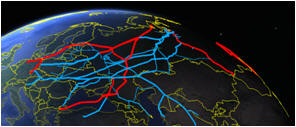
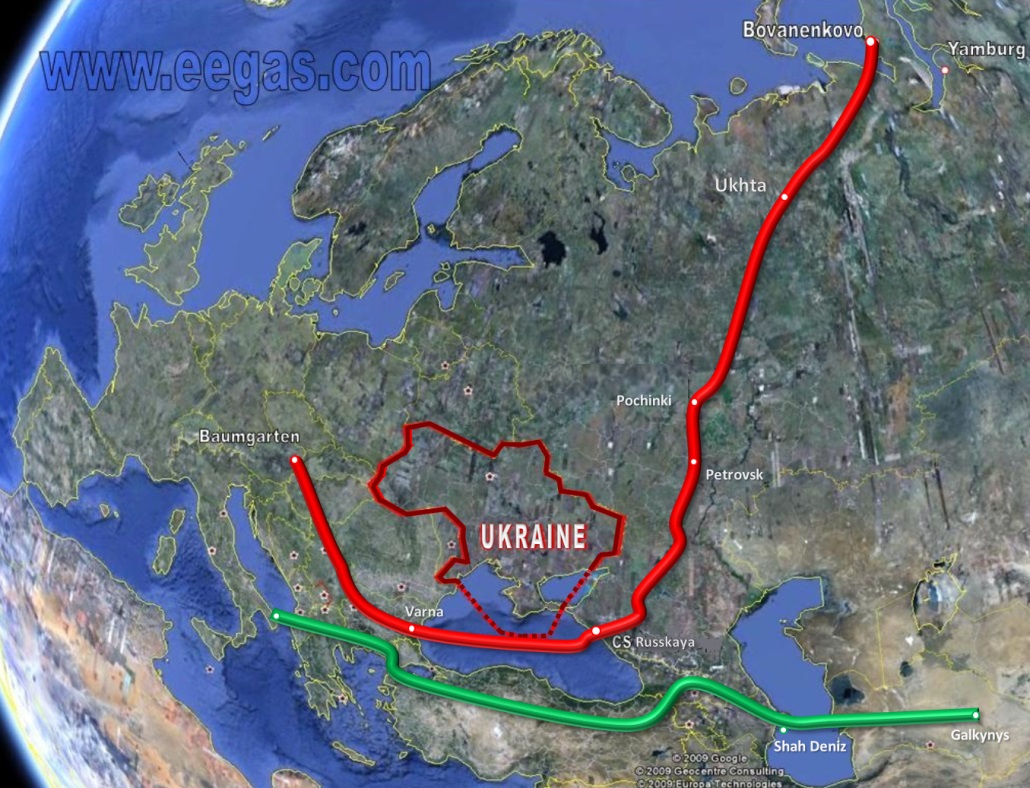
Gazprom pipelines and export capacity

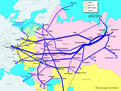
Gas pipelines of West Siberia

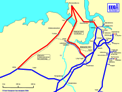
Export flows of Gazprom
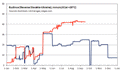
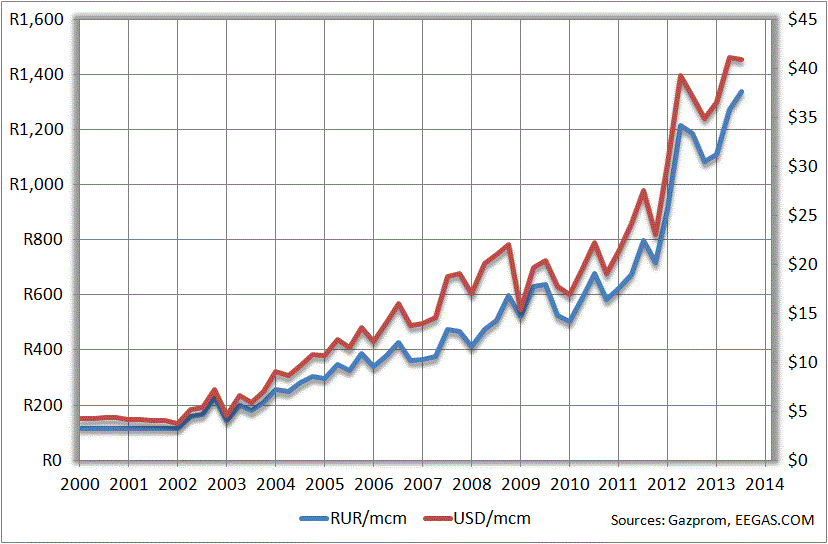
Gas prices


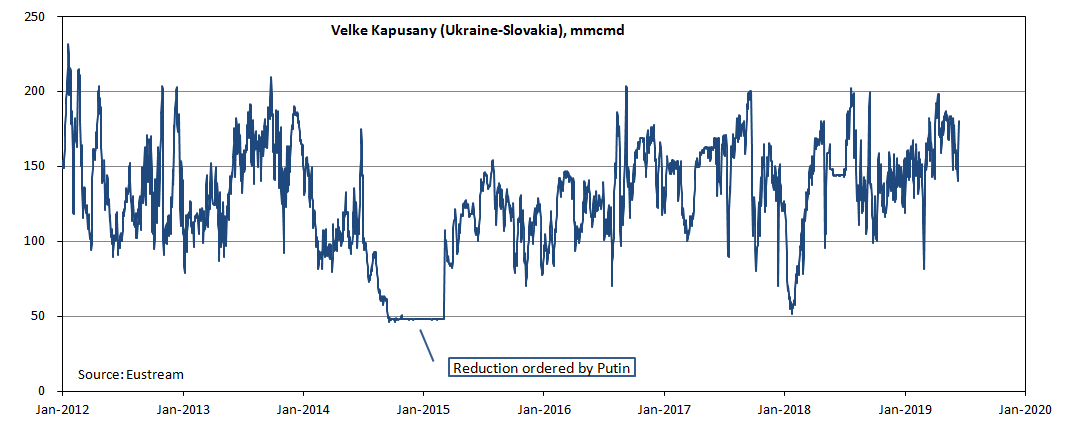
Putin's math of Gas War


Selected Charts and Tables


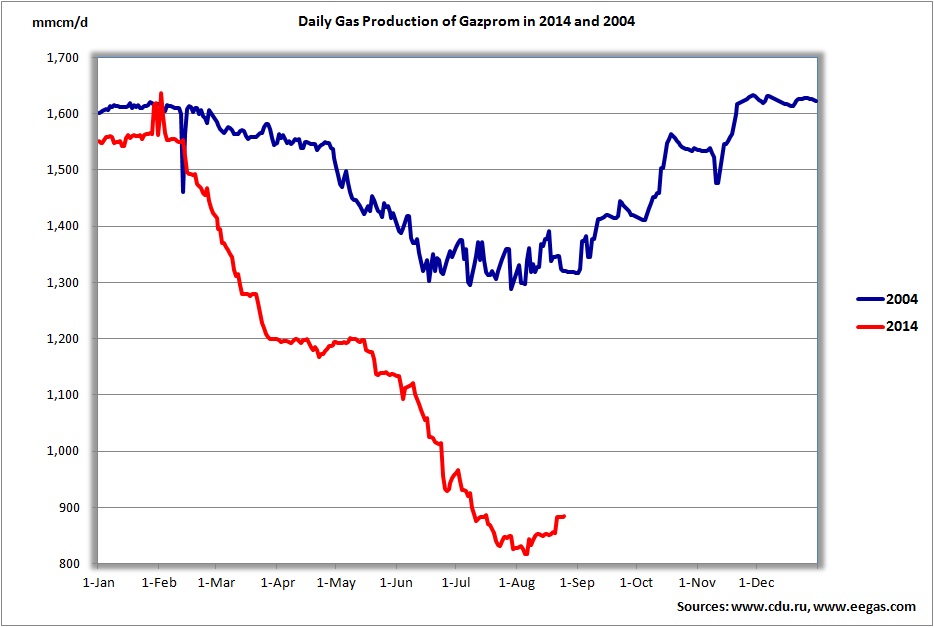
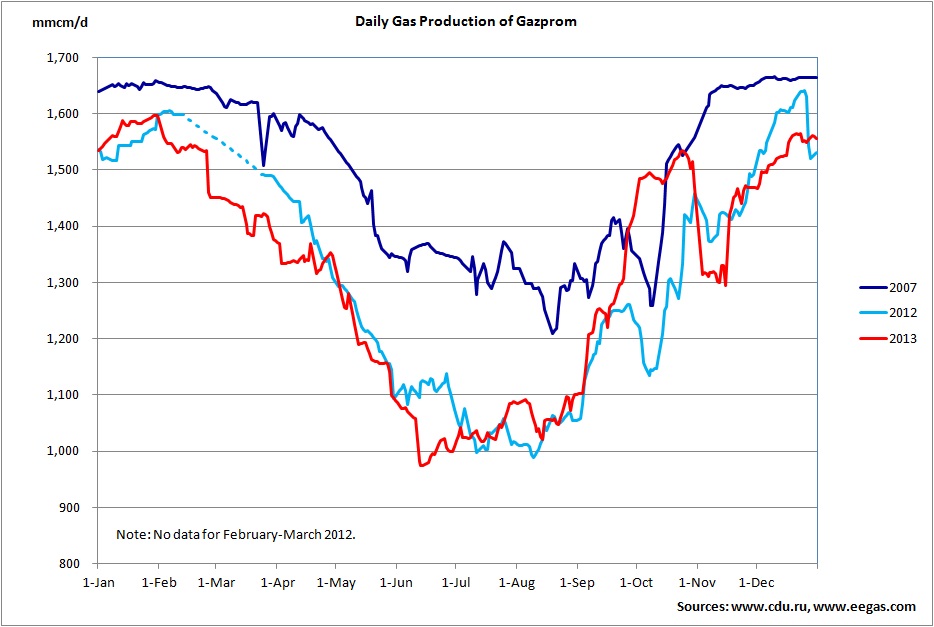
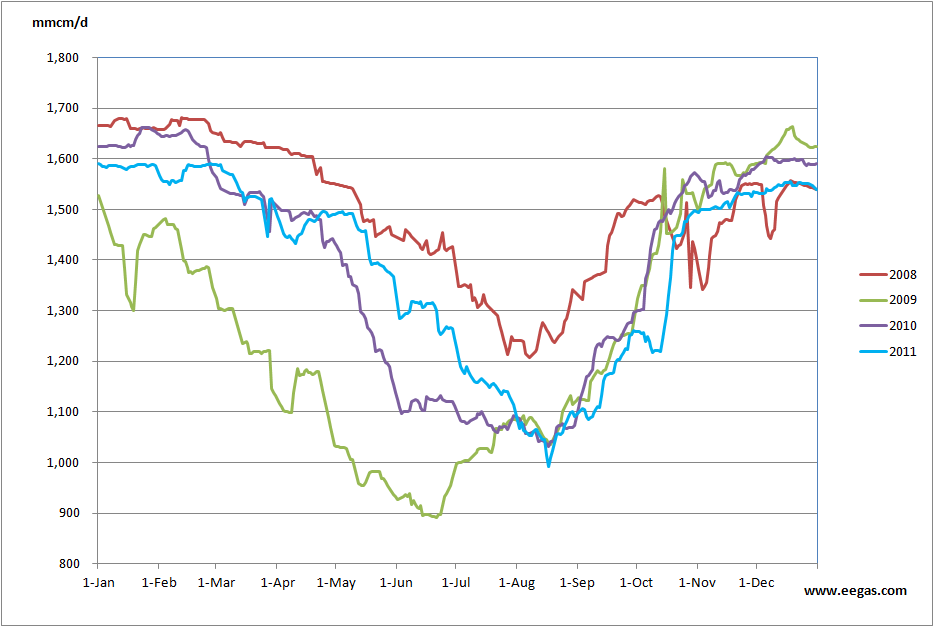
Chart's or Table's Title

Flow out of Ukraine from December 2019
Flow from Russia to Ukraine from December 2019
Strandzha 2 flow from Turkey to Bulgaria
Major exports flows from Sep-2019
Daily exports via Nord Stream, Poland and Ukraine
Daily deliveries via OPAL and V. Kapusany
Malkoclar (Bulgaria-Turkey) daily flow 2017-today
Malkoclar (Bulgaria-Turkey) daily flow 2012-2019
Oil, gas and coal production in Russia, 2005-2016
Everything you always wanted to know about NS2 - The Hague
Everything you always wanted to know about Nord Stream 2
Ukrainian 18-wheeler replaced by tuk-tuk truck
Nord Stream 2015 - screenshot from transparency.entsog.eu
Nord Stream flow reduction in Jan-Mar 2015
Europe net gas imports 2005-2017
Italy daily gas imports 2017
Russian gas exports to France in 2000-2016
Russian gas exports to Finland in 2000-2016
Price of natural gas and oil in 2014-2019
Brent price dynamics in 2008-2011 and 2014-2017
Brent and Ruble in 2014-2016 percent
Brent and Ruble in 2014-2016
Brent and Ruble in 2008-2009 percent
Brent and Ruble in 2008-2009
Selected gas prices in Europe from 2014, MMBtu
Gas production cost from 2000, per mcm
U.S. and Russia's daily natural gas production, Jan-2010 = 100
France: Russian gas imports 2005-2014 and Dunkirk LNG
Budince daily flows in 2018-2019, mmcm/d
Budince daily flows in 2017-2018, mmcm/d
Budince daily flows in 2015-2017, mmcm/d
Budince daily flows in 2014-2015, mmcm/d
Velke Kapusany daily flows in 2017-2018, mmcm/d
Velke Kapusany daily flows in 2015-2017, mmcm/d
Velke Kapusany daily flows in 2014-2015, mmcm/d
Velke Kapusany daily flows in 2012-2018, mmcm/d
Velke Kapusany daily flows in 2013-2014, mmcm/d
Nord Stream daily flows in 2017-2018, mmcm/d
Nord Stream daily flows in 2015-2017, mmcm/d
Nord Stream daily flows in 2014-2015, mmcm/d
Nord Stream daily flows in 2013-2014, mmcm/d
OPAL - Brandow daily flows in 2013-2014, mmcm/d
Monthly gas production 2000-2005-2010-2015
Daily gas production of Gazprom in 2013 and 2014
Daily gas production of Gazprom in 2014 and 2004-A
Daily gas production of Gazprom in 2014 and 2004
Daily gas production of Gazprom in 2007, 2012 and 2013
Daily gas production of Gazprom in 2003 and 2013
Daily gas production of Gazprom in 2009-2012
Daily gas production of Gazprom in 2008-2011
South Stream versus TANAP & TAP
Gas production cost of Gazprom in 2000-2013
End-use price of gas for power generation in Russia and the US
Velke Kapusany daily flows in 2011-2013, mmcm/day
Mallnow daily flows in 2011-2013, mmcm/day
Nord Stream daily flows in 2011-2013, mmcm/day
OPAL - Brandov daily flows in 2011-2013, mmcm/day
Malkoclar daily flows in 2012-2013, mmcm/day
Regulated Price of Gas in Russia


Last modified: 03/04/20                    © East European Gas Analysis 2006-2020                                           Email: info@eegas.com
Reproduction or use of materials is allowed only with reference to East European Gas Analysis or www.eegas.com