|
Gazprom reallocates costs and reports
unreal
trends
1. More costs reallocated to the
transmission segment
The
nine-month financial report of Gazprom shows that the Russian
gas monopoly is increasing its transmission expenses by allocating
more costs to the gas transportation segment.
Table
1. Operating Expenses of Gazprom, RUR Billion
|
Expense item |
2008-Q1 |
2008-Q2 |
2008-Q3 |
Q2-Q1(1) |
Q3-Q1(1) |
|
Purchased oil |
35 |
46 |
53 |
11 |
18 |
|
Purchased gas |
103 |
101 |
128 |
-2 |
25 |
|
Staff cost |
72 |
58 |
55 |
-14 |
-17 |
|
Depreciation |
56 |
43 |
46 |
-13 |
-11 |
|
Taxes other than
profit tax |
64 |
61 |
61 |
-3 |
-2 |
|
Other operating
expenses |
208 |
181 |
181 |
-27 |
-27 |
|
Total operating expenses: |
537 |
489 |
524 |
-48 |
-14 |
|
Expenses by segment (2) |
|
|
|
|
|
|
- Gas production |
61 |
60 |
52 |
-2 |
-9 |
|
- Gas
transmission |
79 |
98 |
113 |
20 |
34 |
(1) Reported quarter
minus the 1st quarter of 2008.
(2) External expenses
that are reported as operating costs.
In Q3-2008, nearly all
operating expenses of Gazprom were lower than these of the 1st
quarter. The cost of purchased gas is the major growing component of
the operating expenses of the gas business of Gazprom. In Q2 and
Q3-2008, the total operating costs of Gazprom were lower than in
Q1-2008.
In Q2 and Q3-2008,
operating costs reported as external expenses of the gas
transmission segment were higher than in Q1-2008 by 25% and 43%
respectively (total expenses of the transmission segment were up by
17% and 29%). Apparently, Gazprom reallocated more costs to the
transmission segment. It looks like the higher is the price of
Turkmen gas, the higher gets the transmission expense.
It indicates that
Gazprom is getting ready to file a new application for an increase
of the state-regulated tariff for gas transit services. This is
a bad news for the independent gas producers in Russia.
2. Unreal trends
As usually, the reported
segment expenses of Gazprom for the 4th quarter show unreal
trends.
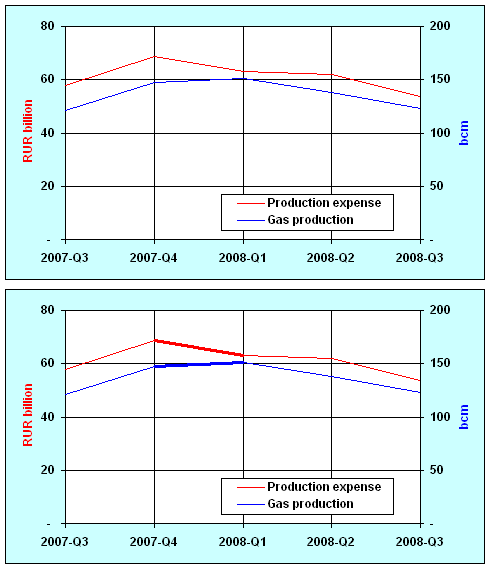
From Q4-2007 to Q1-2008,
gas production increased by 3% while the total production expense
decreased by 8%. This is impossible.
|
Figure 1. Quarterly Production
Expense of Gazprom |
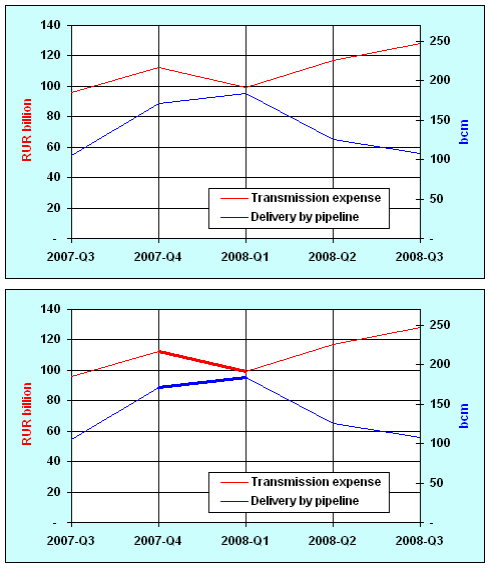
Figure 2.
Quarterly Transmission Expense of Gazprom |
|
 |
 |
Note: The charts
show the total expenses of the production and transmission segments of
Gazprom.
From Q4-2007 to Q1-2008, the
volume of gas delivered by Gazprom pipelines increased by 7% while the total
transmission expense dropped 11%. This is not possible.
Figure 2 also illustrates the
growth of the transmission expense in Q2 and Q3 of 2008.
Starting from 2006,
the total transmission expenses of the 1st or 4th quarter go down
despite the growth of the gas volumes delivered by Gazprom
pipelines. These irregularities
indicate that the reported quarterly expenses are wrong.
Mikhail
Korchemkin
March
10, 2009
Reproduction or use of the materials is allowed only with the reference to East European Gas
Analysis or www.eegas.com
|