|
Gazprom
pipelines and export capacity
Газопроводы Газпрома и экспортные мощности
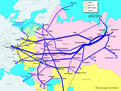
Gas pipelines of West Siberia

Газопроводы Западной Сибири
Export flows of Gazprom
Экспортные потоки
Spot, Gazprom, Brent
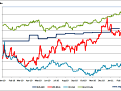
Цены на нефть и
газ
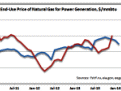
End-use price of gas
Russia and USA
Daily gas production
Суточная добыча
| |
Important Changes in Russian Gas
Business Environment
|
Source:
Roskomstat - RF Department of Statistics |
Source:
Roskomstat - RF Department of Statistics |
|
Source: Roskomstat - RF Department of
Statistics |
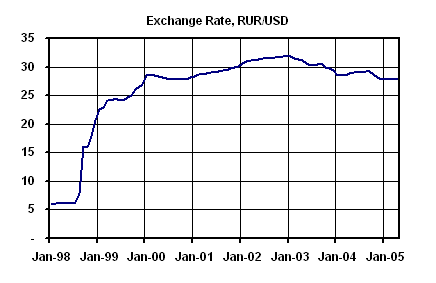
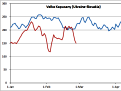
Source: RF Central Bank |
|
 |
-
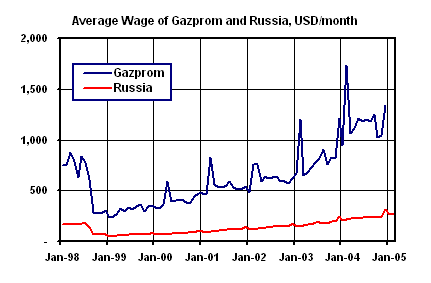
A small part of this growth is explained by a
weaker dollar.
-
The average Gazprom wage is five times higher
than the Russian average.
-
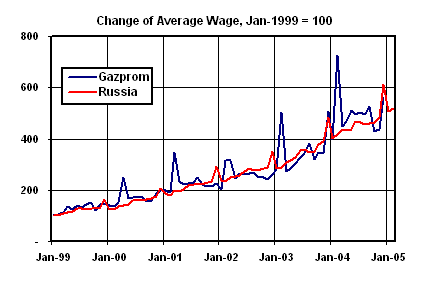
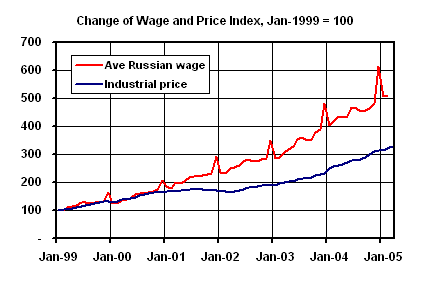
The growth of domestic costs has a direct impact
on both operating and investment costs of all Russian businesses. The speed
of growth affects the future delivery cost of gas for domestic and export
markets.
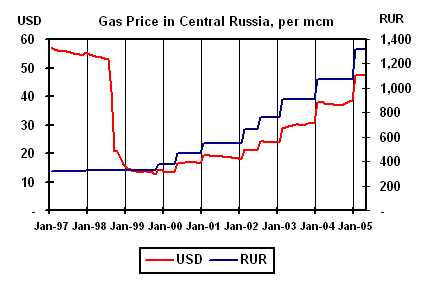
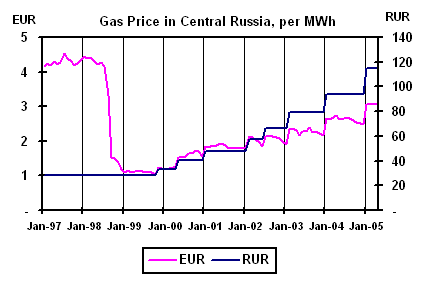
Gas Price in Russia
|
|
 |
 |
|
Source:
RF Federal Tariff Service, |
Source:
RF Federal Tariff Service |
|
-
The left chart shows gas price for
non-residential consumers in Zone 9 (former Zone 5 - Central European
Russia) in rubles and dollars per thousand cubic meters (mcm), net of VAT.
-
The right chart shows the same price in rubles
and euros per MWh, net of VAT.
|
|