|
Profitability of domestic gas
sales depends on the accounting method
Gazprom's
financial report
for 2006 points out the way the Russian monopoly splits gas production
and procurement costs between European exports
and domestic sales. Table 1 shows the reported revenues and cost of
sales. Dollar values are calculated at the average exchange rates of the
corresponding years.
Table
1.
Gazprom Revenue and Cost of Sales (by Russian Accounting Standards -
RAS)
Gas sales in Russia |
2006
|
2005
|
|
Exports
to Europe |
2006
|
2005
|
Millions of Rubles:
|
|
|
|
Millions
of Rubles:
|
|
|
Revenue from gas sales
|
366,226 |
315,202 |
|
Revenue from gas sales
|
754,320 |
562,475 |
Purchase cost of gas
|
137,383
|
116,932
|
|
Purchase cost of gas
|
58,506 |
49,425 |
|
Transportation
cost of gas |
235,933 |
190,076 |
|
Transportation
cost of gas |
239,089 |
200,074 |
|
|
373,316
|
307,008
|
|
|
297,594 |
249,499 |
|
Profit (loss) |
-7,090 |
8,194 |
|
Profit (loss) |
456,725 |
312,976 |
|
Profit divided by
total cost of sales |
-2% |
3% |
|
Profit divided by
total cost of sales |
153% |
125% |
|
Gazprom
sales in Russia, bcm |
316.3 |
307.0 |
|
Gazprom
exports to Europe, bcm |
161.5 |
156.1 |
|
Cost of gas, RUR/
1000 cub m (1) |
434 |
381 |
|
Cost of gas, RUR/
1000 cub m (1) |
362 |
317 |
|
Reported cost, RUR/
1000 cub m (2) |
NA |
335 |
|
Reported cost, RUR/
1000 cub m (2) |
NA |
335 |
|
|
|
|
|
|
|
|
|
Millions
of
US Dollars: |
|
|
|
Millions
of
US Dollars: |
|
|
Revenue from gas sales
|
13,469 |
11,142 |
|
Revenue from gas sales
|
27,743 |
19,882 |
Purchase cost of gas
|
5,053 |
4,133 |
|
Purchase cost of gas
|
2,152 |
1,747 |
|
Transportation
cost of gas |
8,677 |
6,719 |
|
Transportation
cost of gas |
8,793 |
7,072 |
|
|
13,730 |
10,852 |
|
|
10,945 |
8,819 |
|
Profit (loss) |
-261 |
290 |
|
Profit (loss) |
16,798 |
11,063 |
|
Profit divided by
total cost of sales |
-2% |
3% |
|
Profit divided by
total cost of sales |
153% |
125% |
|
Gazprom
sales in Russia, bcm |
338.0 |
328.3 |
|
Gazprom
exports to Europe, bcm |
150.1 |
147.1 |
|
Cost of gas, USD/
1000 cub m (1) |
14.95 |
12.59 |
|
Cost of gas, USD/
1000 cub m (1) |
14.34 |
11.88 |
|
Reported cost, USD/
1000 cub m (2) |
NA |
11.83 |
|
Reported cost, USD/
1000 cub m (2) |
NA |
11.83 |
|
Average exchange
rate, RUR/USD |
27.19 |
28.29 |
|
Average exchange
rate, RUR/USD |
27.19 |
28.29 |
Notes:
(1) Cost of gas per 1000 cub m = (Purchase
cost of gas) / (Volume); (2) By IFRS.
Sources:
Gazprom Financial Report
2006;
Gazprom Quarterly Report Q1-2007;
Gazprom IFRS
Financial Statement 2005
Table 1 shows the 2005
production cost of Gazprom by International Financial Reporting Standards (IFRS),
which is different from that by RAS. Production cost by RAS is not reported.
The accounting method of Gazprom
increases the cost of domestic sales and decreases the cost of exports.
Specifically, cost of sales is affected by the following factors.
-
Gazprom buys gas from
Russian independent producers at a price higher than the average
production cost of Gazprom. For instance, Gazprom was buying gas from
Rosneft at $18.82/ 1000 cub m in 2005 and at $20.58 in 2006.
-
It looks like all gas purchased from independent
producers is
allocated to the domestic sales, which raises the total cost of gas sold
to Russian consumers.
-
Exports
include only gas produced by Gazprom.
It is perfectly legal to use
this accounting method for the calculation of cost of sales. Moreover,
Gazprom can assume that exports are composed of gas produced at the low-cost
fields, while Russian consumers buy gas produced at high-cost reservoirs.
That would result in even higher profits from exports and bigger losses from
domestic sales. Please note that Gazprom wants the domestic price of gas to
provide the same netback as export sales (revenue minus VAT or export duty
minus cost of foreign transit). The state-regulated
price is to reach the "equal-netback" level in 2011. Apparently,
Gazprom uses the reported loss from domestic sales as an argument for faster
growth of regulated price and against tax increase.
It is worth noting that
consolidated
exports of Gazprom to Europe went up from 127 bcm in 2001 to 156 bcm in 2005. In the
same period, domestic sales of gas produced by Gazprom increased from 282 bcm
to 286 bcm. It indicates that nearly all increase of gas production of
Gazprom (and production investment) was caused by growing exports, while the books show higher cost of
gas for domestic sales.
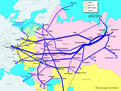
In the near future, all
production growth of Gazprom will be caused by growing demand out of the
former Soviet Union (FSU). Gazprom plans a major increase of gas exports out
of the FSU. Sales of Gazprom's own gas in Russia will go down
respectively with more independent gas coming to the domestic market.
Major share of sales to the FSU is covered by Central Asian gas.
Annual report of Gazprom
explains who is going to finance the export program of the Russian monopoly.
-
"In
order to develop new deposits, sources need to be found to compensate
for the growing cost of natural gas. There are no reserves for the price
growth in Europe, as the long-term forecast of the world market
situation does not reveal any considerable increase in gas prices.
Moreover, there is a noticeable influence of low prices in the spot
market on the general price situation in Western Europe. Considering the
above, the problem can only be resolved through setting economically
reasonable prices in the natural gas markets in Russia and CIS
countries."
This statement is correct under
an assumption that major share of expensive gas would go to to the Russian
market. It is worth noting that Gazprom's gas fields commissioned before
2006 are capable to meet all Russian demand through 2011. After that,
combined output of these fields of Gazprom and production of independent producers can
cover Russian demand for another 5-7 years. If the new high-cost reservoirs
were fully allocated to the export sales, their expensive production would
not be required in Russia until 2016.
I am grateful to the journalists
of Vedomosti who pointed out a mistake
in the table and an inaccurate definition. Financial report under Russian
standards shows non-consolidated sales, so export volumes should reflect
only Gazprom's gas. Note that non-consolidated report gives the volume of
domestic sales of Gazprom in 2006 at 338.0 bcm, while
the consolidated report puts it at 316.3 bcm.
Mikhail Korchemkin, Managing Director
June 8, 2007
(with corrections of June 26, 2007)
|