|
At a recent meeting in
Sochi, Russia's Prime Minister Vladimir Putin has asked
himself a very good question: -
What's more
profitable for a company - to be more flexible and make concessions
to retain its full market share or be tougher, don't give in and
take a loss in market share? According to Mr. Putin's answer, the top
management of Gazprom is doing right thing by staying tough, and Alexey Miller's (or
rather Vladimir Putin's) team should be given the opportunity to go
on this way.
It is educative to look
at the European results of the current management of Gazprom appointed
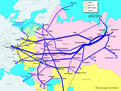
by Mr. Putin in 2001. Figure 1 shows the shares of Russia, Norway,
Algeria and Qatar in the total gas imports of
OECD Europe and Figure 2 these suppliers' shares in imports from
out of the European Union.
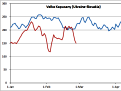
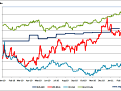
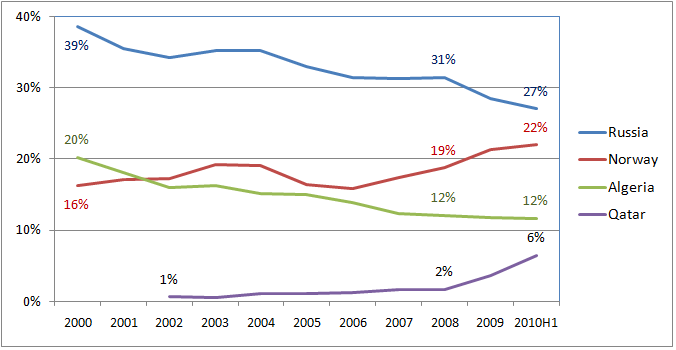
Gazprom was and is steadily
losing its market share in OECD Europe. From 2000 to 2008, share of
Russian gas in the total imports of OECD Europe has dropped from 39%
to 31% (Figure 1). In the same period, Russia's share in the Non-EU
imports of OECD Europe has decreased from 48% to 39% (Figure 2).
Europe was buying more gas, but most of the incremental supply came not from Russia.
The
speed of decline has more than doubled in 2008-2010, when Gazprom's
competitors gave in, but the Russian gas monopoly stayed tough.
Figure
1. Major Gas Suppliers' Share in the Total Imports of OECD Europe
Figure
2. Major Gas Suppliers' Share in Non-EU Imports of OECD Europe
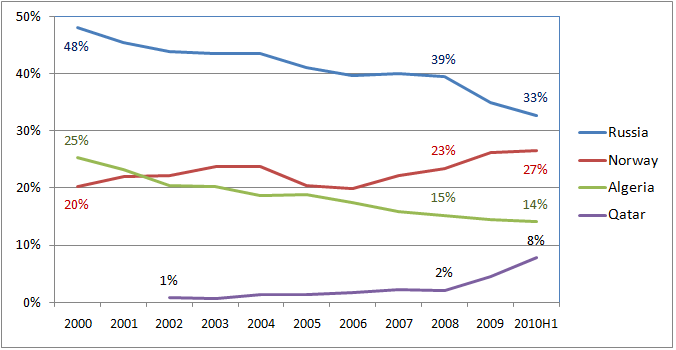
Sources:
International Energy Agency;
Botas.
Flexibility of gas
exporters from Qatar, Norway and some other countries has produced
impressive results. In June 2005, exports of Norway represented 42%
and Qatar just 4% of these of Russia (Table 1). Combined export
volume of Norway and Qatar was less than half of Gazprom's. Five
years later, in June 2010, Norway and Qatar jointly exported 10%
more gas than Russia. There were a lot of lost opportunities for
Gazprom in Europe.
Table 1. Russian,
Norwegian and Qatari Gas Exports to OECD Europe, bcm
|
Exporter |
Jun-2005 |
Jun-2006 |
Jun-2007 |
Jun-2008 |
Jun-2009 |
Jun-2010 |
|
Russia |
9.5 |
9.0 |
10.1 |
10.7 |
9.7 |
8.8 |
|
Norway |
4.0 |
4.1 |
4.7 |
5.6 |
6.1 |
7.7 |
|
Qatar |
0.4 |
0.5 |
0.4 |
0.6 |
0.8 |
2.0 |
|
|
|
|
|
|
|
|
|
Norway/Russia, % |
42% |
46% |
47% |
54% |
63% |
87% |
|
Qatar/Russia, % |
4% |
5% |
4% |
6% |
8% |
23% |
Source:
International Energy Agency.
In my view, these
numbers prove that Vladimir Putin and the people he put in charge of
Gazprom are wrong. Apparently, nine years of experience is not
enough for them, and Alexey Miller's team will go on staying tough.
This is good news for the competitors of Gazprom and bad news for
the shareholders of the Russian gas giant.
Mikhail Korchemkin
East European Gas
Analysis
September 14, 2010
Malvern, PA, USA
|