|
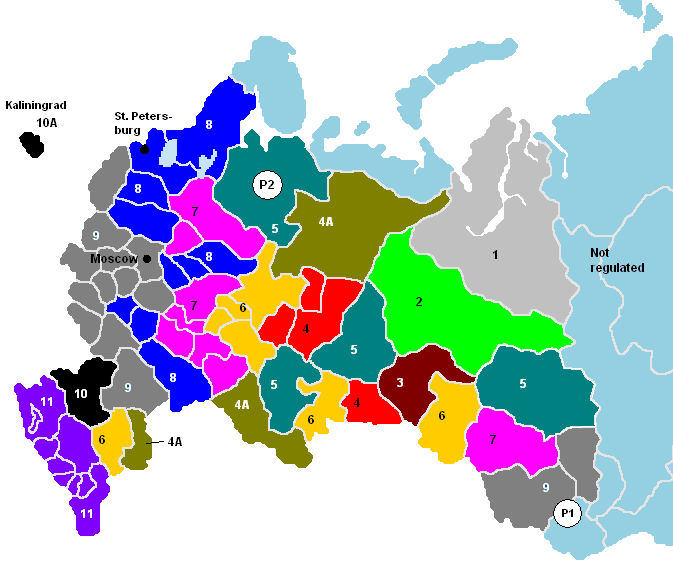
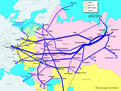
(Click here for the legend
map of administrative regions)
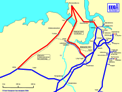
P1 - Consumers of Altay region
that are supplied by the Barnaul-Biisk-GornoAltaysk pipeline.
P2 - Consumers of Arkhangelsk
region that are supplied by the Nyuksenitsa-Arkhangelsk pipeline (section 147th
km – Mirnyi).
Table 1. Regulated Price of Gas in
the Service Area of Gazprom in 2007, per 1000 cub m, Net
of VAT (*)
|
|
1 |
2 |
3 |
4 |
4A |
5 |
6 |
7 |
8 |
9 |
10 |
10A |
11 |
P1
|
P2
|
|
RUR per 1000 cub m
|
|
|
|
|
|
|
|
|
|
|
|
|
|
|
|
|
Residential
|
779 |
835 |
913 |
986 |
958 |
992 |
1,001 |
1,015 |
1,030 |
1,043 |
1,058 |
1,196 |
1,058 |
1,427 |
1,836 |
|
Non-residential
|
779 |
937 |
1,104 |
1,242 |
1,198 |
1,270 |
1,306 |
1,320 |
1,382 |
1,427 |
1,477 |
1,673 |
1,489 |
1,673 |
2,360 |
|
USD 1.00 = RUR
24.46 |
|
|
|
|
|
|
|
|
|
|
|
|
|
|
|
|
Residential
|
32 |
34 |
37 |
40 |
39 |
41 |
41 |
41 |
42 |
43 |
43 |
49 |
43 |
58 |
75 |
|
Non-residential
|
32 |
38 |
45 |
51 |
49 |
52 |
53 |
54 |
56 |
58 |
60 |
68 |
61 |
68 |
96 |
|
EUR 1.00 = RUR
35.91 |
|
|
|
|
|
|
|
|
|
|
|
|
|
|
|
|
Residential
|
22 |
23 |
25 |
27 |
27 |
28 |
28 |
28 |
29 |
29 |
29 |
33 |
29 |
40 |
51 |
|
Non-residential
|
22 |
26 |
31 |
35 |
33 |
35 |
36 |
37 |
38 |
40 |
41 |
47 |
41 |
47 |
66 |
|
Maximum
non-residential price |
|
|
|
|
|
|
|
|
|
|
|
|
|
|
|
|
RUR per 1000 cub m
|
1,246 |
1,500 |
1,766 |
1,987 |
1,916 |
2,032 |
2,090 |
2,112 |
2,211 |
2,284 |
2,363 |
2,677 |
2,383 |
2,677 |
3,776 |
|
USD per 1000 cub m
|
51 |
61 |
72 |
81 |
78 |
83 |
85 |
86 |
90 |
93 |
97 |
109 |
97 |
109 |
154 |
|
EUR per 1000 cub m
|
35 |
42 |
49 |
55 |
53 |
57 |
58 |
59 |
62 |
64 |
66 |
75 |
66 |
75 |
105 |
(*)
Regulated price paid by local distribution companies and major consumers that
buy gas from Gazprom and its affiliates (net of VAT, VAT = 18%).
Notes: Federal Tariff Service does not regulate gas
price in other regions of Russia. Maximum price can be applied to new consumers
and consumers buying gas above the volumes contracted for 2007.
Sources: RF Federal Tariff Service Order No
338-e/1 of December 5, 2006; RF Federal Tariff Service Order No
158-e of July 6, 2007.
Table 2. Regulated Price of Gas in
the Service Area of Gazprom in 2008, per 1000 cub m, Net of VAT
|
|
1 |
2 |
3 |
4 |
4A |
5 |
6 |
7 |
8 |
9 |
10 |
10A |
11 |
P1
|
P2
|
|
RUR per 1000 cub m
|
|
|
|
|
|
|
|
|
|
|
|
|
|
|
|
|
Residential
|
973 |
1,044 |
1,141 |
1,232 |
1,197 |
1,241 |
1,251 |
1,269 |
1,288 |
1,304 |
1,323 |
1,495 |
1,323 |
1,784 |
2,111 |
|
Non-residential
|
973 |
1,172 |
1,380 |
1,553 |
1,497 |
1,587 |
1,633 |
1,650 |
1,727 |
1,784 |
1,846 |
2,091 |
1,862 |
2,091 |
2,596 |
|
USD 1.00 = RUR
24.46 |
|
|
|
|
|
|
|
|
|
|
|
|
|
|
|
|
Residential
|
40 |
43 |
47 |
50 |
49 |
51 |
51 |
52 |
53 |
53 |
54 |
61 |
54 |
73 |
86 |
|
Non-residential
|
40 |
48 |
56 |
63 |
61 |
65 |
67 |
67 |
71 |
73 |
75 |
85 |
76 |
85 |
106 |
|
EUR 1.00 = RUR
35.91 |
|
|
|
|
|
|
|
|
|
|
|
|
|
|
|
|
Residential
|
27 |
29 |
32 |
34 |
33 |
35 |
35 |
35 |
36 |
36 |
37 |
42 |
37 |
50 |
59 |
|
Non-residential
|
27 |
33 |
38 |
43 |
42 |
44 |
45 |
46 |
48 |
50 |
51 |
58 |
52 |
58 |
72 |
|
Maximum
|
|
|
|
|
|
|
|
|
|
|
|
|
|
|
|
|
non-residential
price |
|
|
|
|
|
|
|
|
|
|
|
|
|
|
|
|
RUR per 1000 cub m
|
1,460 |
1,758 |
2,070 |
2,330 |
2,246 |
2,381 |
2,450 |
2,475 |
2,591 |
2,676 |
2,769 |
3,137 |
2,793 |
3,137 |
3,894 |
|
USD per 1000 cub m
|
60 |
72 |
85 |
95 |
92 |
97 |
100 |
101 |
106 |
109 |
113 |
128 |
114 |
128 |
159 |
|
EUR per 1000 cub m
|
41 |
49 |
58 |
65 |
63 |
66 |
68 |
69 |
72 |
75 |
77 |
87 |
78 |
87 |
108 |
Source: RF Federal Tariff
Service Order No 403-e/1 of December 4, 2007.
Notes: All prices are
increased by 25%, except for Zone P2 (Arkhangelsk region), where the residential
price is up 15% and non-residential 10%. The FTS document lists 67 price zone -
one per administrative region. However, there are 15 different price groups,
same as in 2007.
All Dollar and Euro prices are given
at the exchange rate of November 16, 2007.
Administrative Regions of the
Russian Federation (Service Area of Gazprom)
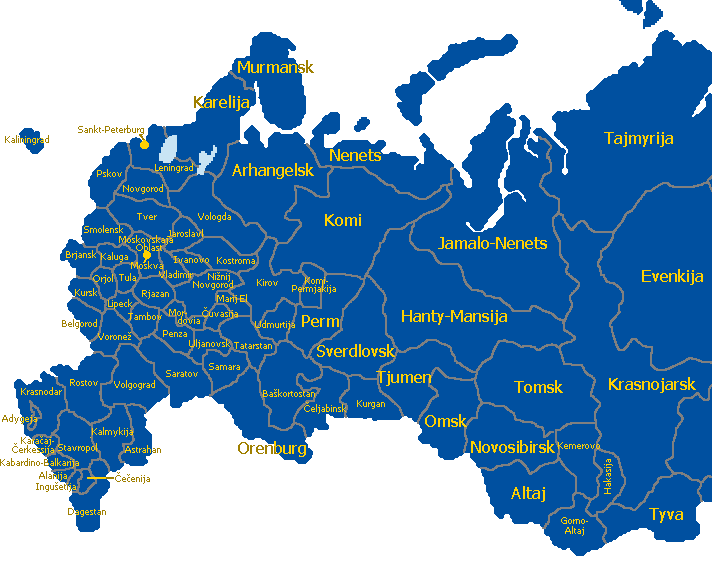
(Click here to return to the
map of pricing zones)
Note: Komi-Permjakija now is a part of Perm
region.
Source of map of administrative regions:
http://www.world-gazetteer.de/s/s_ru.htm
|