|
Table 1.
Residential Price of Gas in 2008 and 2009, Net of VAT
|
Administrative regions |
Residential, RUR/mcm |
Residential, USD/mcm |
Residential, EUR/mcm |
RUR price |
|
2008 |
2009-Q1 |
2009-Q2 |
2009-Q3 |
2009-Q4 |
2008 |
2009-Q1 |
2009-Q2 |
2009-Q3 |
2009-Q4 |
2008 |
2009-Q1 |
2009-Q2 |
2009-Q3 |
2009-Q4 |
Q1/2008 |
Q4/2008 |
|
Bashkortostan |
1,241 |
1,302 |
1,393 |
1,491 |
1,583 |
50 |
38 |
43 |
48 |
54 |
35 |
29 |
32 |
33 |
36 |
105% |
128% |
|
Leningrad oblast |
1,288 |
1,352 |
1,447 |
1,548 |
1,644 |
52 |
40 |
45 |
49 |
56 |
36 |
30 |
33 |
35 |
38 |
105% |
128% |
|
Moscow |
1,304 |
1,369 |
1,465 |
1,568 |
1,665 |
52 |
40 |
45 |
50 |
57 |
36 |
31 |
33 |
35 |
38 |
105% |
128% |
|
USD/RUR and EUR/RUR rate: |
|
|
|
|
|
24.88 |
33.93 |
32.21 |
31.34 |
29.31 |
35.93 |
44.70 |
43.81 |
44.76 |
43.48 |
|
|
(*) Except consumers in the
areas of new pipeline construction.
Altay-1 - Consumers of Altay region
that are supplied by the Barnaul-Biisk-GornoAltaysk pipeline, section 87th km -
border of the Altay region.
Altay-2 - Same area, pipeline
section from the border of Altay to Gorny Altay.
Arkhangelsk-1 - Consumers of Arkhangelsk
region that are supplied by the Nyuksenitsa-Arkhangelsk pipeline (section 147th
km – Mirnyi).
Arkhangelsk-2 - Same area,
pipeline section from Mirnyi to Arkhangelsk.
Projected average exchange rate for
Q4-2009.
Click here to download
the full table in Excel format.
Table 2.
Non-Residential Price of Gas in 2008 and 2009, Net
of VAT
|
Administrative regions |
Non-residential, RUR/mcm |
Non-residential, USD/mcm |
Non-residential, EUR/mcm |
RUR price |
|
2008 |
2009-Q1 |
2009-Q2 |
2009-Q3 |
2009-Q4 |
2008 |
2009-Q1 |
2009-Q2 |
2009-Q3 |
2009-Q4 |
2008 |
2009-Q1 |
2009-Q2 |
2009-Q3 |
2009-Q4 |
Q1/2008 |
Q4/2008 |
|
Bashkortostan |
1,587 |
1,666 |
1,781 |
1,904 |
2,021 |
64 |
49 |
55 |
61 |
69 |
44 |
37 |
41 |
43 |
46 |
105% |
127% |
|
Leningrad oblast |
1,727 |
1,819 |
1,951 |
2,093 |
2,228 |
69 |
54 |
61 |
67 |
76 |
48 |
41 |
45 |
47 |
51 |
105% |
129% |
|
Moscow |
1,784 |
1,880 |
2,019 |
2,168 |
2,310 |
72 |
55 |
63 |
69 |
79 |
50 |
42 |
46 |
48 |
53 |
105% |
129% |
|
USD/RUR and EUR/RUR rate |
|
|
|
|
|
24.88 |
33.93
|
32.21
|
31.34
|
29.31
|
35.93 |
44.70 |
43.81 |
44.76 |
43.48 |
|
|
(*) Except consumers in the
areas of new pipeline construction.
Altay-1 - Consumers of Altay region
that are supplied by the Barnaul-Biisk-GornoAltaysk pipeline, section 87th km -
border of the Altay region.
Altay-2 - Same area, pipeline
section from the border of Altay to Gorny Altay.
Arkhangelsk-1 - Consumers of Arkhangelsk
region that are supplied by the Nyuksenitsa-Arkhangelsk pipeline (section 147th
km – Mirnyi).
Arkhangelsk-2 - Same area,
pipeline section from Mirnyi to Arkhangelsk.
Projected average exchange rate for
Q4-2009.
Click here to download
the full table in Excel format.
The RF Federal Tariff Service Order
#413-e/11 gives the prices for all administrative regions in the service area of
Gazprom without specifying pricing zones. Formerly, the FTS was raising the
price once a year, on January 1. This year the price is raised every
quarter. The maximum price for new consumers and supplies above the contractual
level of 2007 is set at 140% of the regulated price (Table 2) in Q1 and Q2 and
130% in Q3 and Q4-2009.
In Q1-Q3-2009, gas price in USD and EUR is lower
than a year ago because of the devaluation of the ruble.
The original documents of the Federal Tariff Service can be downloaded from
here.
Click here
for gas prices and pricing zones of 2007-2008.
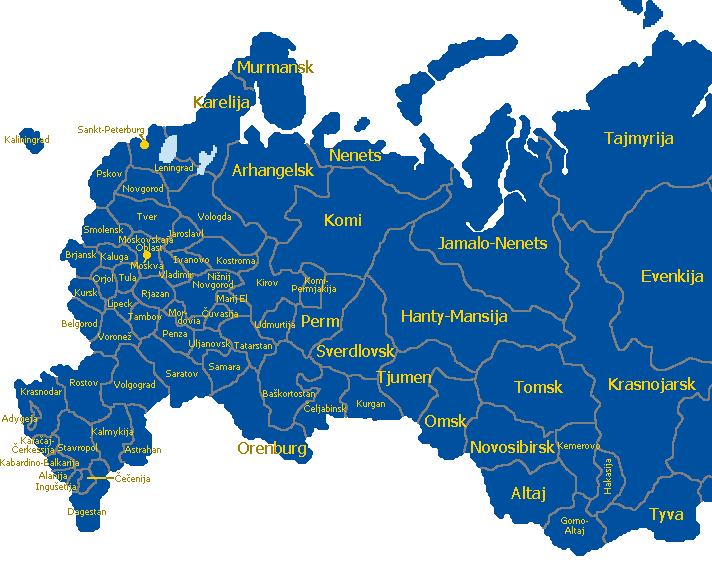
Administrative Regions of the
Russian Federation (Service Area of Gazprom)

Note: Komi-Permjakija now is a part of Perm
region.
Source of map of administrative regions:
http://www.world-gazetteer.de/s/s_ru.htm
November 15, 2009
|