|
RosUkrEnergo Wins, Gazprom and NAK Lose
RosUkrEnergo is making
daily profits of $3 to $5 million with the half going to unknown
shareholders. This is a very good reason for RUE to stay in the business as
long as possible.
Table 1 compares costs and benefits of Gazprom
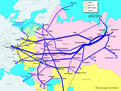
and NAK Naftogaz of Ukraine under transit terms of 2005 and 2006. It is important to include all sales
of Central Asian and Kazakh gas into the analysis of gains and losses of
Gazprom.
Before 2005, ZMB GmbH (Germany, 100% owned by
Gazprom) was exporting Central Asian gas to Europe and states of the former
Soviet Union.
Apparently, Gazprom transferred the exports of
Kazakh gas from ZMB to RUE. Without cheap gas from Kazakhstan, it was
impossible to get the price of $95/mcm at the Ukrainian border, as required
by the agreement between Gazprom, NAK Naftogaz and RUE.
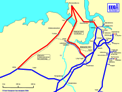
For the sake of simplicity, the exercise does
not take into account transit flow of Russian gas via Ukraine to southern
Russia. It is assumed that Ukraine needs 56 bcm of imported gas and Moldova
3 bcm.
Table 1. Estimated Revenues
and Expenses of Gazprom and NAK Naftogaz Ukraine in 2006
OLD AGREEMENT
|
bcm |
$/mcm |
$ mill. |
NEW AGREEMENT
|
bcm |
$/mcm |
$ mill. |
|
GAS BALANCE |
|
|
|
GAS BALANCE |
|
|
|
|
Demand: |
|
|
|
Demand: |
|
|
|
Ukraine net import
|
56 |
|
|
Ukraine net import
|
56 |
|
|
Moldova import
|
3 |
|
|
Moldova import
|
3 |
|
|
Trans-Caucasus net import
|
7 |
|
|
Trans-Caucasus net import
|
7 |
|
|
Europe via Ukraine
|
118 |
|
|
Europe via Ukraine
|
118 |
|
|
|
|
184 |
|
|
|
184 |
|
|
|
|
|
|
|
|
|
|
|
|
Kazakhstan |
15 |
|
|
Kazakhstan |
15 |
|
|
|
Turkmenistan & Uzbekistan |
48 |
|
|
Turkmenistan & Uzbekistan |
48 |
|
|
|
Gazprom gas required |
121 |
|
|
Gazprom gas required |
121 |
|
|
|
|
184 |
|
|
|
184 |
|
|
|
GAZPROM |
|
|
|
GAZPROM |
|
|
|
Revenue:
|
|
|
|
Revenue:
|
|
|
|
Gazprom to Europe via Ukraine
|
109 |
230
|
25,070
|
Gazprom to Europe via Ukraine
|
101 |
230
|
23,230
|
Gazprom pmt gas to Ukraine
|
21 |
50
|
1,050
|
Gazprom to RUE
|
17 |
170
|
2,890
|
Gazprom to Ukraine for cash
|
8 |
87
|
692
|
Gazprom to Moldova
|
3 |
110
|
330
|
Gazprom pmt gas to Moldova
|
1 |
80
|
80
|
ZMB to Trans-Caucasus (*)
|
7 |
110
|
770
|
ZMB to Trans-Caucasus (*)
|
7 |
110
|
770
|
Transit to Ukraine
|
56 |
9
|
514
|
ZMB to Moldova (*)
|
2 |
110
|
220
|
50% of RosUkrEnergo profit
|
|
|
676
|
|
ZMB to Europe (*) |
9 |
230 |
2,070 |
|
184 |
|
28,410
|
|
Transit to Ukraine & Moldova |
27 |
9 |
248 |
|
|
|
|
|
50% of RosUkrEnergo profit |
|
|
350 |
|
|
|
|
|
|
184 |
|
30,550
|
|
|
|
|
|
|
|
|
|
|
|
|
|
Procurement - Kazakhstan gas
|
15 |
30
|
-450
|
Procurement - Kazakhstan gas
|
7 |
30
|
-210
|
Turkmenistan & Uzbekistan
|
21 |
65
|
-1,365
|
Ukrainian transit
|
101 |
20
|
-2,068
|
|
Ukrainian transit |
109 |
14 |
-1,526 |
Export duties
|
121 |
|
-7,935
|
Export duties
|
139 |
|
-8,068
|
|
|
|
-10,213
|
|
|
|
|
-11,409
|
|
|
|
|
|
BALANCE |
|
|
19,141 |
BALANCE |
|
|
18,197 |
Difference from old agreement
|
|
|
-
|
Difference from old agreement
|
|
|
-945
|
|
NAK NAFTOGAZ |
|
|
|
NAK NAFTOGAZ |
|
|
|
Procurement expenses:
|
|
|
|
Procurement expenses:
|
|
|
|
Gazprom payment gas
|
21 |
50
|
-1,050
|
RosUkrEnergo
|
56 |
95
|
-5,320
|
|
Central Asian gas |
35 |
90 |
-3,150 |
Revenue (excl. sales): |
|
|
|
|
|
|
|
-4,200
|
Transit service - Gazprom |
101 |
20 |
2,068 |
|
Revenue (excl. sales): |
|
|
|
Transit service - RUE |
17 |
20 |
348 |
|
Transit service - Gazprom |
109 |
14 |
1,526 |
Storage fee |
15 |
2 |
34 |
|
|
|
|
1,526
|
|
|
|
2,450
|
|
BALANCE BEFORE SALES |
|
|
-2,674 |
BALANCE BEFORE SALES |
|
|
-2,870 |
Difference from old agreement
|
|
|
-
|
Difference from old agreement
|
|
|
-196
|
(*) Transit sales free of Russian export
duties (30% of price).
The assumed price of $170/mcm at which Gazprom
sells gas to RUE may look optimistic to shareholders of Gazprom. In Q3-2005,
Gazprom was selling gas to RUE at $80/mcm, while the average price of
European exports was $196/mcm. RUE exported gas to Europe.
Gazprom's revenue includes 50% of RUE profit.
For 2005, we use conservative estimation of $700, based on published profit
for January-September 2005. RUE profit in 2006 is calculated in Table 2.
Table 2. Estimated
Performance of RosUkrEnergo in 2006
|
bcm |
$/mcm |
$ mill. |
|
Asian gas (priced at
Ukrainian border): |
|
|
|
Procurement - gas from Turkmenistan and Uzbekistan
|
48 |
90 |
-4,320 |
Procurement - gas from Kazakhstan
|
8 |
40 |
-320 |
Total cost and average price of Asian gas:
|
56 |
83 |
-4,640 |
Sales revenue
|
56 |
95 |
5,320 |
|
|
184 |
|
680 |
|
|
|
|
|
|
Procurement cost |
17 |
170 |
-2,890 |
|
Cost of transit via Ukraine |
17 |
20 |
-348 |
|
Export revenue |
17 |
230 |
3,910 |
|
Profit from
exports of Gazprom gas: |
|
|
672 |
|
|
|
|
1,352 |
According to our estimations, if RUE stays in
business through the year, Gazprom would lose about one billion dollars. If Gazprom sells gas RUE at $230/mcm, the loss decreases
to $741 million (see
attached table).
We consider the price of $230/mcm very
unlikely. The short history of RUE shows that maximization of profit of the
Swiss trader has always been among top priorities of Gazprom. In
January-September 2005, gas price set for RUE by Gazprom gave the Swiss
trader a profit of $0.5 billion, which corresponds to a very generous profit
rate of 17%. Technically, this profit was diverted from shareholders of
Gazprom, including the state, to shareholders of RUE.
Under the terms and market conditions of January-February
2006, we estimate the annual loss of NAK Naftogaz at about $200 million
(Table 1).
Despite excellent lobbying capacity of unknown
shareholders of RUE, we expect the Swiss trader to be out of the deal within
few weeks or months.
Mikhail Korchemkin
March
6, 2006
Previous publications on
Russian-Ukrainian gas dispute:
Economics of
Russian-Ukrainian Gas Conflict: Who won the war?
Russian-Ukrainian Gas Conflict: Lack of Free Market in Russia
Russian-Ukrainian Gas Conflict: Financial
Effects of the Russian Side
- 2
Russian-Ukrainian Gas Conflict: Financial Effects of the
Russian Side
Brief
history of Soviet and Russian gas pipeline policy
Clarifying
the math of Ukrainian transit tariff
|